
How to read your financial reports
Your books are caught up and reconciled to the cent. So did you actually make money last month — and could you prove it?
- The Reports module turns your reconciled ledger into financial reports you can trust: four core statements — Profit & Loss, Balance Sheet, Trial Balance, and Cash Flow — for any single entity or a consolidated group, plus a Board Pack, a Tax Rollup, a 1099-NEC/MISC report, and a 13-week cash forecast. Every figure drills to the register behind it.
- Switch the VIEW to one entity or a consolidation group; consolidated reports eliminate intercompany flows so nothing double-counts.
- Read the whole picture in one Board Pack, roll the year to IRS Schedule C at tax time, see a crunch coming 13 weeks out, and export to CSV or QBO for your accountant.
- New to Reports? Start from the tour of all 17 modules.
Why a reconciled ledger still leaves you guessing
Reconciling proves each account matches its statement. It does not tell you whether the business made money, where the cash went, or what you owe at tax time. Those answers live in the statements built on the ledger — and without them you are caught up but still flying blind.
That gap is where the tax-season scramble starts: a year of correctly categorized entries is still not an answer. The Reports module shapes them into a P&L, a balance sheet, and tax lines for you — from the same posted entries, not a spreadsheet you rebuild every March.
How to read your four core statements
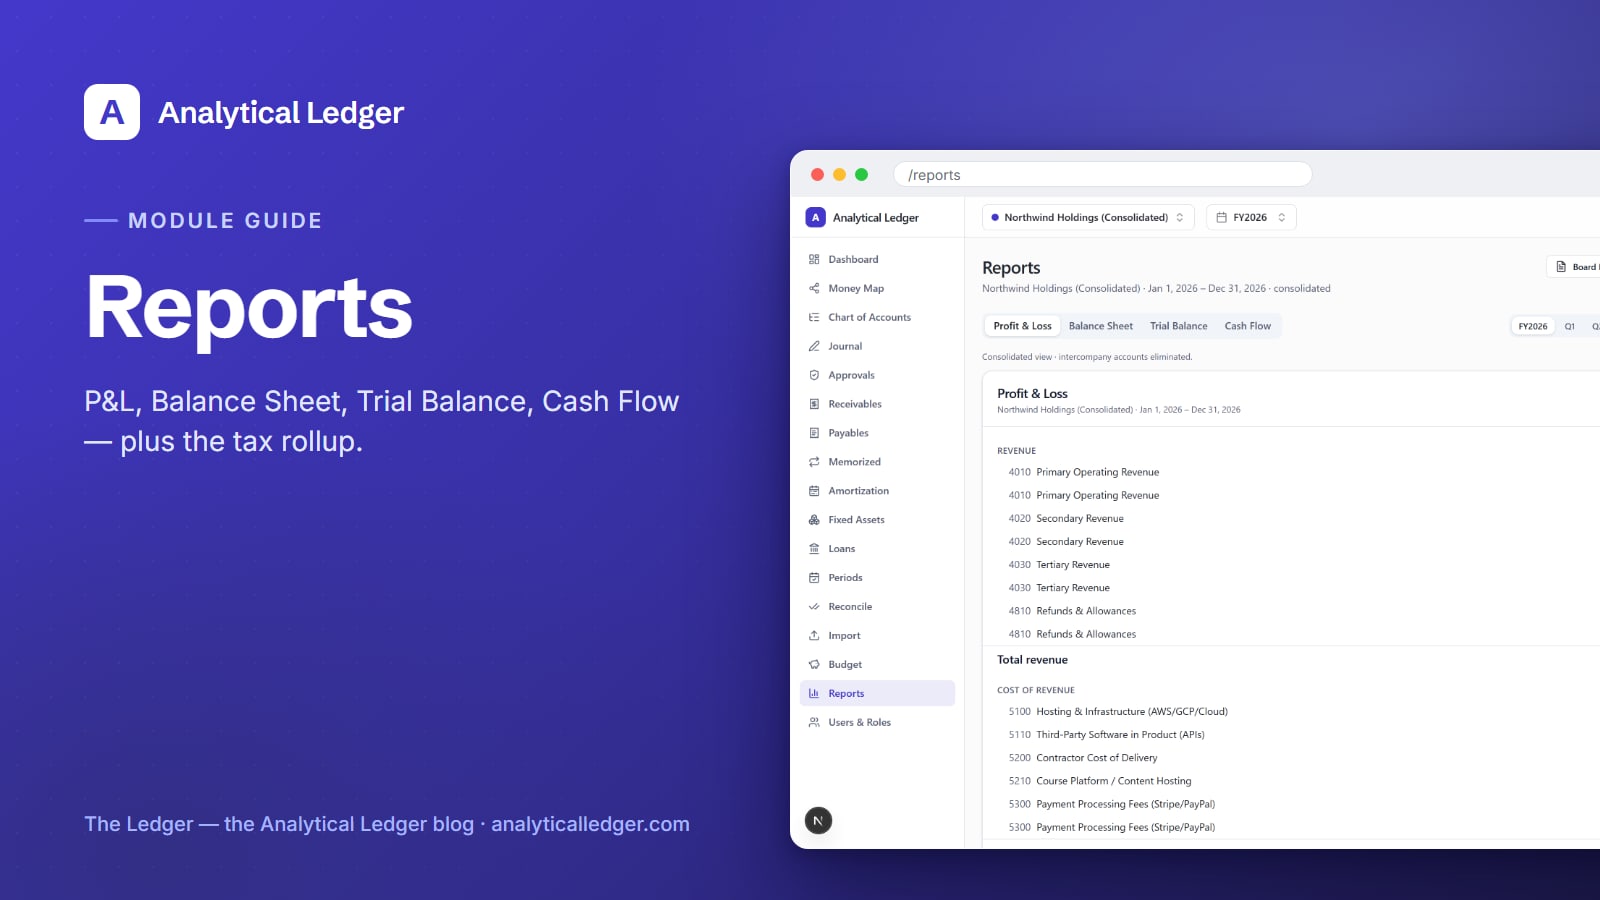
Open /reports and you land on four tabs: Profit & Loss, Balance Sheet, Trial Balance, and Cash Flow. Each reads the same posted journal entries, so they always agree. Pick your VIEW — a single entity or a consolidation group — set the period, and the numbers populate. No rebuild, no export-and-formula.
Profit and Loss — did you make money
The P&L answers the question that keeps owners up at night: did we make money this period? Revenue at the top, expenses below, net income at the bottom — grouped the way your chart of accounts is structured.
Balance Sheet — what you own and owe
The Balance Sheet is the snapshot: assets on one side, liabilities and equity on the other, as of a chosen date — cash on hand, what you are owed, and what you owe. Because every entry must balance, the two sides always tie.
Trial Balance — proof the books balance
The Trial Balance lists every account with its debit or credit total — proof the ledger is internally consistent before you rely on the statements above it. In Analytical Ledger the two columns always match, because balance is enforced twice.
Cash Flow — where the money actually went
Net income is not cash. The Cash Flow statement reconciles the two, showing how operating, investing, and financing activity moved real money in and out — the report that explains a profitable month with a thin bank balance.
What does a consolidated report actually show?
A consolidated report rolls every entity in a consolidation group into one set of statements, then eliminates the intercompany flows so nothing double-counts. If your holding company moved profit to an operating company as a DISTRIBUTION — two matched, balanced entries tagged intercompany — consolidation nets those out. You see the group's real position, not inflated internal transfers.
This is the part off-the-shelf tools charge per company for and still leave you to stitch by hand. Here every ENTITY — personal finances included — lives in one place, and the VIEW switcher flips between one set of books and the whole group. See the multi-entity accounting guide for the full model.
How to run the sub-reports that answer real questions
Beyond the four statements, the Reports module has four purpose-built views: the Board Pack, the Tax Rollup, the 1099-NEC/MISC report, and a 13-week cash forecast. Each shapes the same posted data for a specific moment — a board meeting, tax season, a vendor filing, or a looming cash crunch.
Board Pack — the whole picture on one screen
The Board Pack assembles KPIs, the P&L, and the balance sheet into one board-ready view. It is what you open before a partner meeting or a quiet Sunday check-in — the whole condition of the business at a glance.

Tax Rollup — Schedule C without the excavation
The Tax Rollup rolls the year's P&L up to IRS Schedule C lines. Because the chart of accounts is already mapped to Schedule C and Form 1120, tax season becomes a rollup, not an excavation — the categories you booked all year land on the lines you file.

1099-NEC/MISC — who crossed the $600 threshold
The 1099-NEC/MISC report surfaces reportable vendor payments and flags who crossed the $600 reporting threshold — so you are not scrolling a year of the accounts payable ledger in January to remember which contractors need a form. The threshold note is built in.

13-week cash forecast — see the crunch coming
The 13-week cash forecast lays out cash movement week by week using the direct method. It answers "will we be tight in March?" while it is still January — early enough to act, instead of finding out when a payment bounces.

How do you know a number on the report is right?
Every row links straight to the account register behind it — click a figure and you see the exact journal entries that produced it, down to whether each came from a manual entry, an import, a distribution, or the system. A finality badge marks whether the period is open or closed, so you know if a number can still move; the period-close process locks it and the badge says so.
Money is stored as exact decimals, never floating point, and every entry must balance — enforced in application code and again by database triggers. Posted entries are immutable; you correct a mistake by posting a reversing entry, so the audit trail stays honest.
We run our own group of companies — and our personal finances — on Analytical Ledger, daily, in production, and these are the reports we read to know where each entity stands. To hand numbers off, export any statement to CSV, or the general journal in QBO format for your accountant.
What people get wrong about financial reports
The common mistake is treating reports as a tax-season chore — something you generate once a year, under duress, for someone else. A P&L you only read in April cannot help you run the business the other eleven months. The related misread is assuming a report is only as trustworthy as the spreadsheet behind it. In a real double-entry system the report is not an opinion — it is a view of a ledger that already had to balance to exist. The Board Pack and cash forecast are decision tools because the numbers under them are enforced, not typed.
Frequently Asked Questions
Can I get a consolidated P&L across all my companies?
Yes. Set the VIEW to a consolidation group and the Profit & Loss — along with every other statement — rolls up all entities in that group. Intercompany flows, like distributions moved between your companies, are eliminated automatically, so you see the group's true earnings rather than double-counted internal transfers.
Does the Tax Rollup file my taxes for me?
No — it prepares the numbers, not the filing. The Tax Rollup groups your year's P&L under IRS Schedule C lines, because the chart of accounts is already mapped to Schedule C and Form 1120. You or your preparer take those totals to the return; the report removes the reconstruction work, not the filing itself.
Can I export reports to give to my accountant?
Yes. Any statement exports to CSV, and you can export the general journal in QBO format, which most accounting tools import directly. It is your data — hand it off whenever you want, in a format your accountant already works in, with no lock-in and no waiting on a vendor.
What does the finality badge on a report mean?
The finality badge tells you whether the period behind a report is open or closed. An open period can still change as you post entries; a closed period is settled and its numbers are fixed. It is a quick, honest signal about whether the figure in front of you is final or still in motion.
See your own numbers in one view
The fastest way to trust a report is to run it on your own books. Pull your entities into one place, reconcile, and open /reports — the P&L, Board Pack, and 13-week forecast all read the same balanced ledger. See how the app fits together, or follow the module tour to whichever guide you need next.
About Analytical Solutions
Analytical Solutions builds Analytical Ledger — free, multi-entity, double-entry accounting for the owner doing their own books. We run our own group of companies, and our personal finances, on these exact reports, daily, in production. Learn more about us.