
How to read the Analytical Ledger dashboard
You open the books to answer one question — did we make money, and do we have cash — and end up clicking through four reports to piece it together.
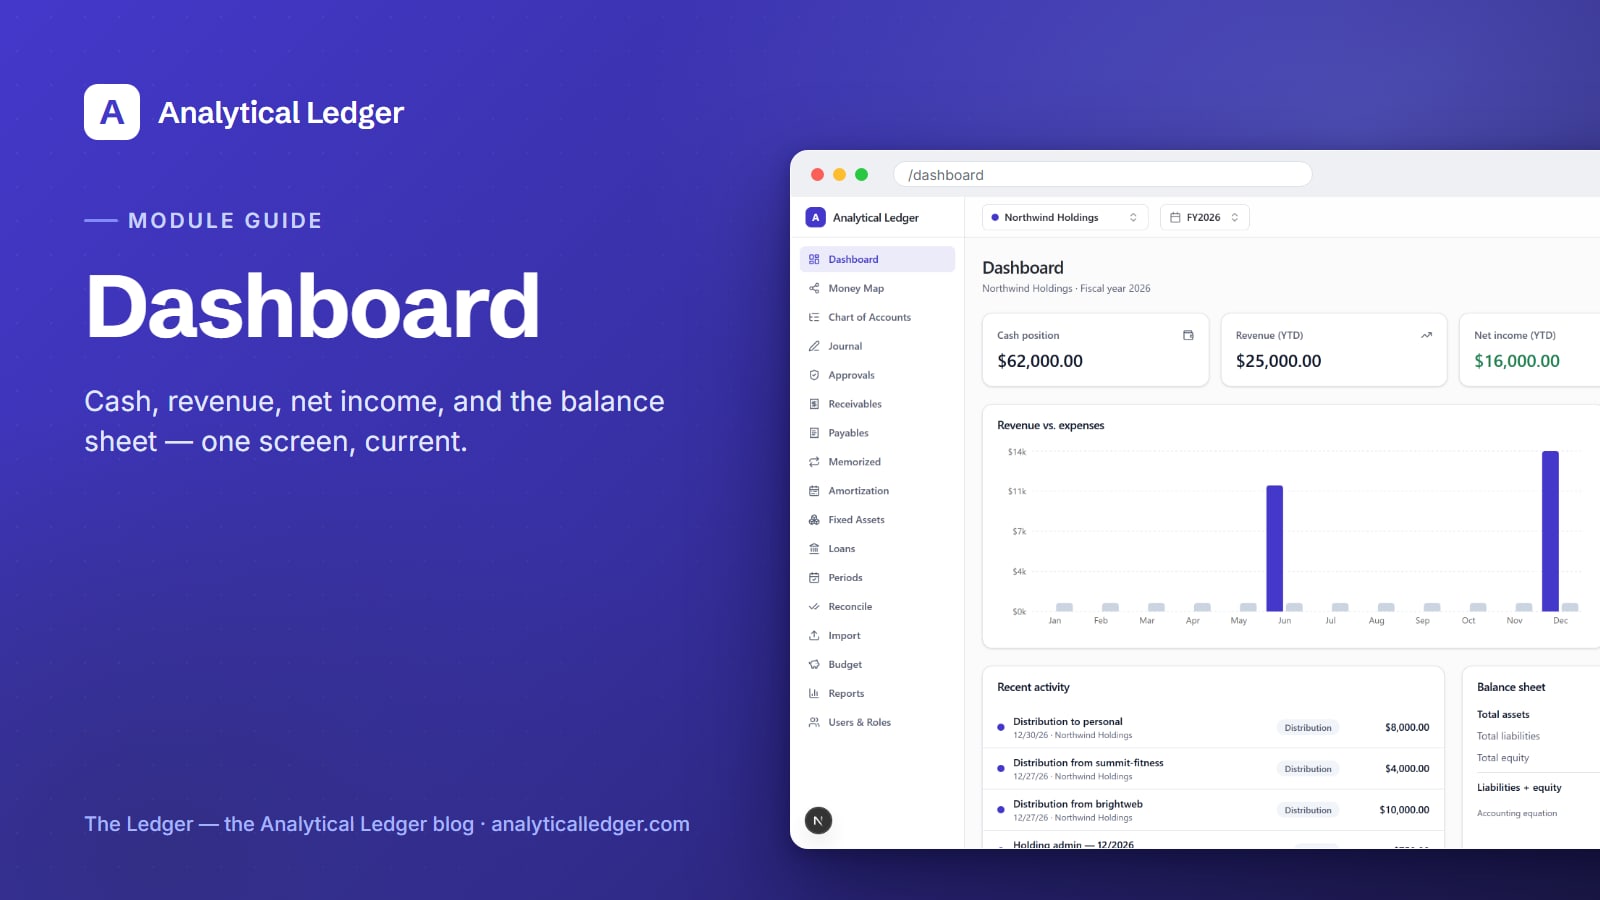
- The Analytical Ledger dashboard is the landing screen for every entity: four KPI cards (cash position, revenue year-to-date, net income year-to-date, total assets), a revenue-versus-expenses chart, a P&L summary, a balance sheet panel with a Balanced badge, and a recent-activity feed — the condition of the business on one screen.
- Read cash and profit in five seconds, before you touch a single report.
- Confirm the books still balance without opening the trial balance.
- Switch between a single entity and a consolidated view of the whole group from the top bar.
- Start with the module tour if you want the map of all 17 modules first.
Why does hunting for your numbers cost more than it looks?
Every minute you spend assembling the picture by hand is a minute you're not selling or delivering — and the picture you assemble is a guess. When cash, profit, and the balance sheet live in separate reports, you check one, trust your memory on the other two, and act on a number that's already stale.
That's how owners end up flying blind at the worst possible moment. Money gets tight and you can't see it coming, because the last time you looked at the whole picture was three weeks and forty transactions ago. A dashboard exists so the answer is always one screen away — never a research project.
What does the Analytical Ledger dashboard show you?
Everything you need to answer "where do we stand" without opening a report. The dashboard is the landing screen for the entity or group you're viewing, scoped to the selected fiscal year. It stacks four KPI cards, a revenue-versus-expenses chart, a P&L summary, a balance sheet panel, and a live activity feed — each one a doorway into the module behind it.
The four KPI cards
The top row is the five-second read. Four cards carry the numbers you check most: cash position, revenue (year-to-date), net income (year-to-date), and total assets. Cash tells you what you can spend today. Revenue and net income tell you whether the year is working. Total assets ties to the balance sheet below. Glance at the row and you know the shape of the business before you scroll.
Revenue versus expenses, month by month
Below the cards, a monthly bar chart plots revenue against expenses across the fiscal year. This is the trend the KPI cards can't show: whether the gap between what you earn and what you spend is widening or closing. A month where the expense bar overtakes revenue is a flag you want to catch in the dashboard, not discover in the P&L three weeks later.
The P&L summary panel
The profit-and-loss panel condenses the income statement to the lines that matter, year-to-date: revenue, cost of revenue, gross profit, operating expenses, operating income, and net income. You read straight down the page and watch profit form — sales, minus what it cost to deliver them, minus the cost of running the business. If a number looks wrong, it usually traces to a miscategorized entry in your chart of accounts.
The balance sheet panel and the Balanced badge
The balance sheet panel shows total assets, total liabilities, and total equity — and a Balanced badge that confirms the accounting equation holds: assets equal liabilities plus equity. That badge is the quiet proof the whole system is sound. In Analytical Ledger money is stored as exact decimals and every entry must balance, enforced in the app and again by database triggers, so the badge reflects a real invariant, not a rounding.
The recent activity feed
The activity feed lists the latest journal entries as they post, each tagged with a source chip — manual, import, distribution, or system — so you can see at a glance where an entry came from. It's the pulse of the ledger. After you import and post a batch of bank transactions, the feed is where you confirm they landed before you move on.
How do you read the dashboard across every entity?
Use the entity switcher in the top bar. The header tells you which context you're in — Single entity for one set of books, or Consolidated view for a named group of entities rolled up together. Switch the entity or the fiscal year from that same bar, and every card, chart, and panel below re-scopes instantly to match.

In a consolidated view, the numbers are the whole group netted correctly — intercompany flows between your entities are eliminated, so a distribution moved from one company to another doesn't double-count as revenue for the group. That's the difference between a real consolidated picture and a pile of separate reports you add up by hand. Personal finances count as a first-class entity here, so "everything — business and personal" is a view you can actually see. Running more than one entity is where this earns its keep.
What owners get wrong about the dashboard
They treat it as the source of truth instead of the reading. The dashboard shows year-to-date totals for the selected fiscal year — it's a summary of posted entries, not a place you edit anything. If a KPI card looks off, the fix isn't on the dashboard; it's a journal entry to correct, a statement left to reconcile against the bank, or a period still open.
The second mistake is ignoring the Balanced badge because "it's always balanced." It is always balanced — because the system enforces it — but the badge is still worth a glance. It confirms you're looking at a coherent set of books, and it's the fastest sanity check you have before you trust a report or hand numbers to your accountant. Posted entries are immutable in Analytical Ledger; you correct by posting a reversing entry, never by overwriting, which is exactly why the dashboard can be trusted as a read.
We build this by using it
We run our own group of companies — and our personal finances — on Analytical Ledger, daily, in production. The dashboard is the first screen we open every morning: cash position, net income year-to-date, and the Balanced badge, across the consolidated group. It's the fastest honest answer to "where do we stand" we've found, which is why it's the landing screen and not a report you have to go looking for.
Frequently Asked Questions
What does the Analytical Ledger dashboard show?
It shows four KPI cards — cash position, revenue year-to-date, net income year-to-date, and total assets — plus a revenue-versus-expenses chart, a P&L summary, a balance sheet panel with a Balanced badge, and a feed of recent journal entries. It's the landing screen for the selected entity and fiscal year.
Can I see all my entities on one dashboard?
Yes. Switch from Single entity to a Consolidated view in the top bar to roll a named group of entities into one dashboard. Consolidated numbers eliminate intercompany flows, so distributions between your companies don't double-count. Personal finances are a first-class entity, so you can view business and personal together.
Does the dashboard update automatically?
Yes. The dashboard reads posted journal entries for the selected fiscal year, so every KPI card, chart, and panel reflects the current state of the ledger. Post an entry or import a batch and the recent-activity feed shows it, with the KPI totals re-scoped the next time the screen loads.
What is the Balanced badge on the dashboard?
The Balanced badge confirms the accounting equation holds — total assets equal total liabilities plus equity. In Analytical Ledger every entry must balance, enforced in the app and again by database triggers, so the badge reflects a real invariant. It's your fastest sanity check that the books are coherent before trusting any report.
Can I edit numbers on the dashboard?
No. The dashboard is a read-only summary of posted entries, not an editing screen. To change a figure, post or correct a journal entry, reconcile the account against the bank, or check whether a period is still open. Posted entries are immutable — you fix by posting a reversing entry.
Start where your questions are
If you're setting up, open the dashboard first and let it tell you what's missing — an empty KPI card is a prompt for the next module to visit. New here? Start with why we built Analytical Ledger, or see the app and its modules on the product page to know the condition of your business on one screen. Questions about your own setup? Talk it through with us.
About Analytical Solutions. We build Analytical Ledger — free, multi-entity, double-entry accounting, correct to the cent and yours to keep. We run our own group of companies and our personal finances on it, daily, in production, and the dashboard is the first screen we open. More about us.